Zeacom Agent Workflow research
The Map
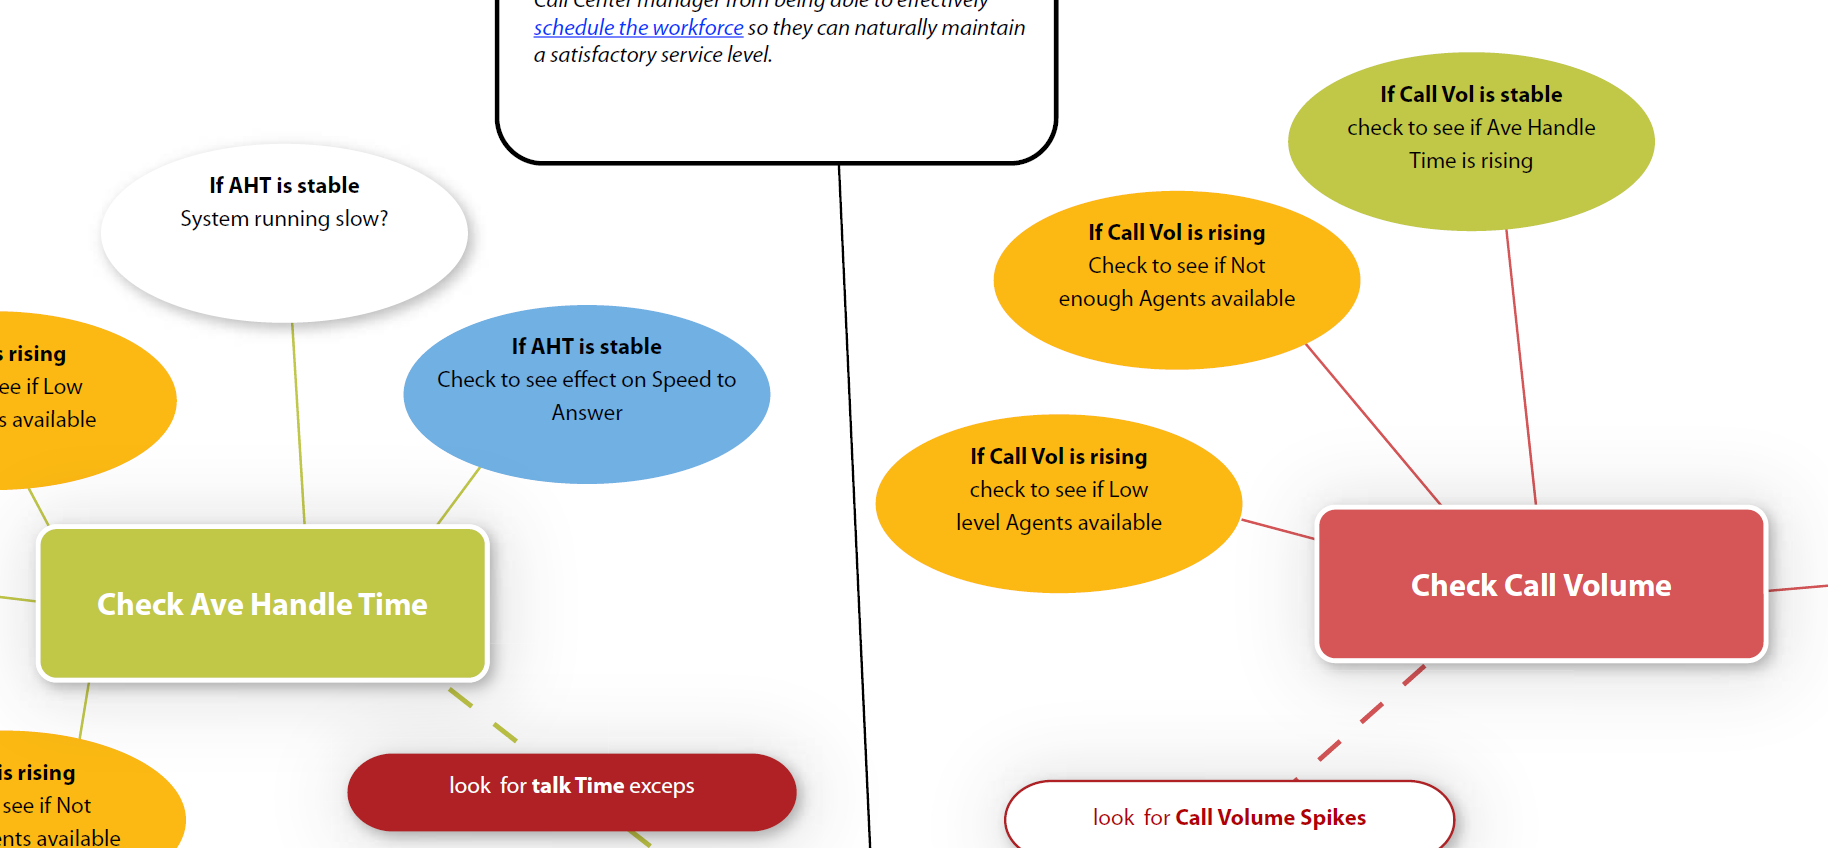
The map is a research document and shows possible cause and effects of just two problems a call centre can face. "Low Service Level", customers are being turned away, and "High Service Level", you are paying too many agents.
Each problem displays four main routes of investigation, gives advice about each and suggests errors and alerts to look out for on the way.
Background
The Zeacom call centre software is a large and complex product. The help application contains over 600 pages of explanitary documentation. The documentation concentrates on describing the fields on each screen. Every label, menu, button and its subsequent function is explained.
Cause and Effect
Every dip in service level, rise in call volume or extending wait time can be the result of a combination of events. For instance "Average Wait Time" shows us how long someone has been put on hold. Reasons for this could be that the system isn't efficient and agents do not have the information they need readily available, the agents may need more training for the queue they are working on, or there may not be enough specifically skilled agents available when high call volumes are predicted.
There is zero value in a help file that displays the fact that "AHT means Average Handle Time" if someone is looking for information because the caller waiting time has significantly increased from the norm.
ROI Call centre managers have to provide optimum service on very tight budgets. If there are any imperfections in the call centre work flow, return on investment will drop rapidly. If "Average Handle Time" rises, clients are waiting, agents get pressured and fewer calls get answered...
A help file that not only shows the meaning of a term but can suggest paths of contextual, holistic investigation, could help managers maintain deeper understanding and spot trends that could effect them.