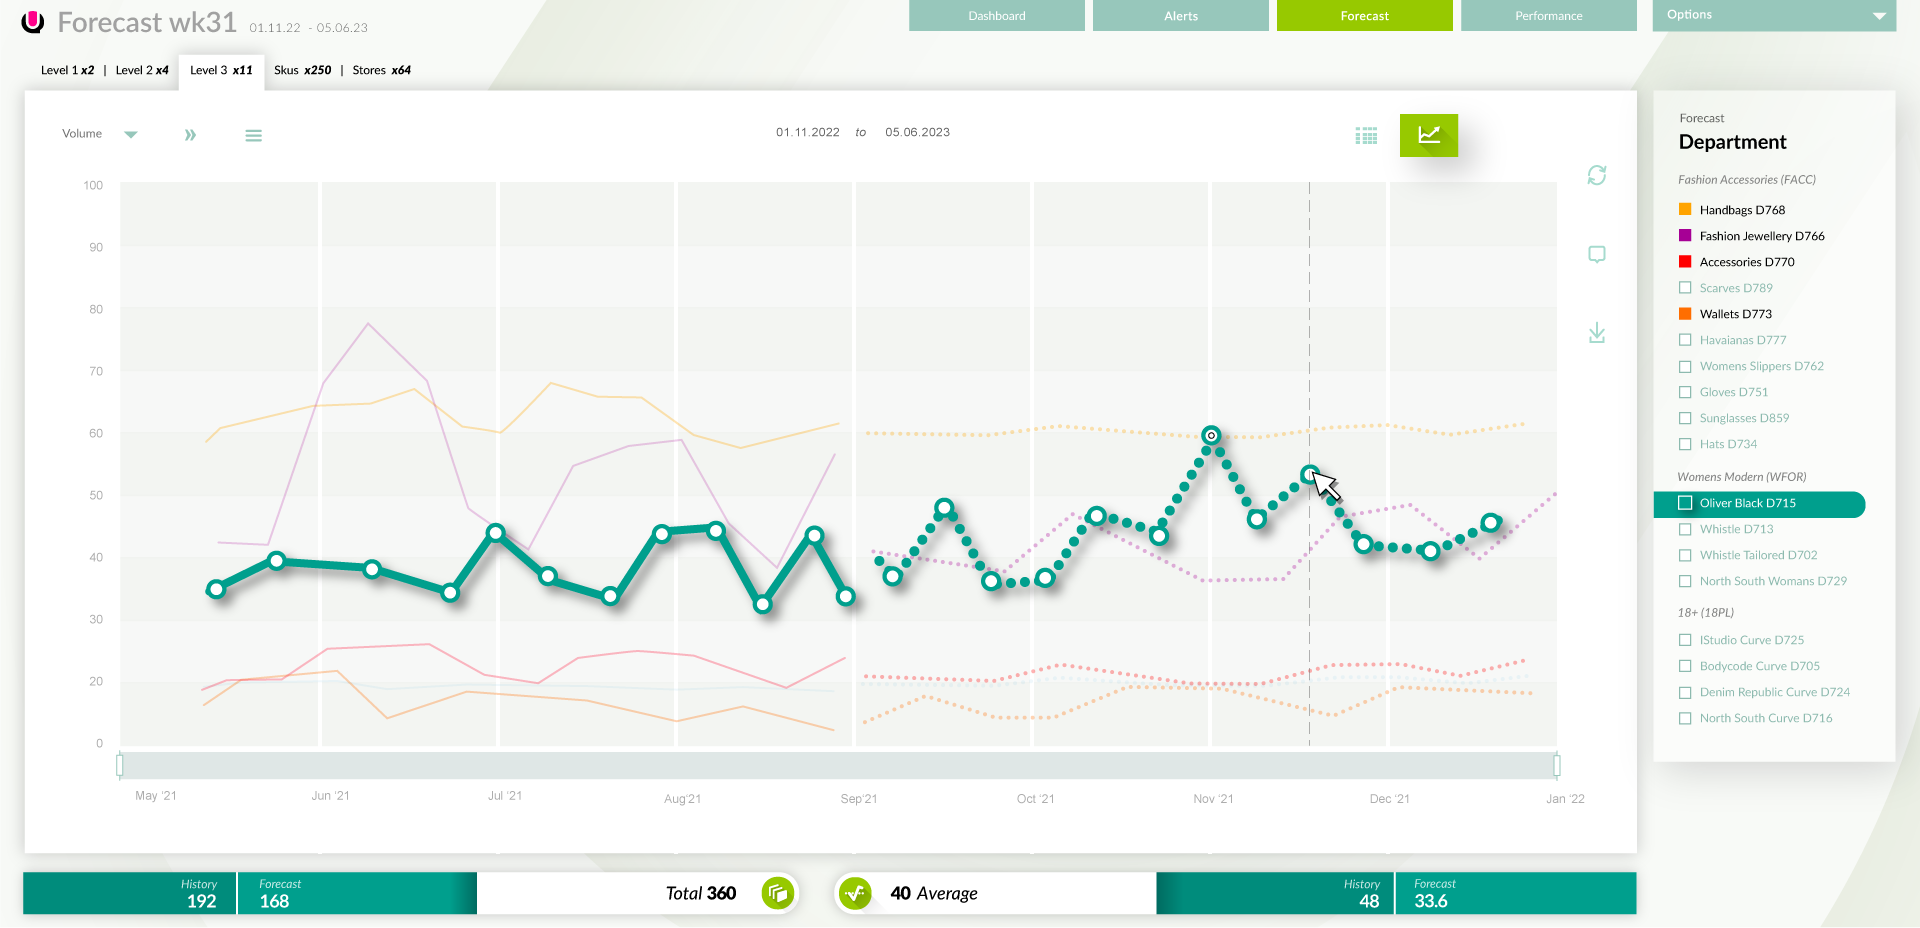
As well as being able to quickly see Customer social activity and any corresponding buying patterns, the ability to cross reference and check forecasts, sales histories, and their own KPI's was needed to inspire trust in Quantiful's brilliant Algorithms.
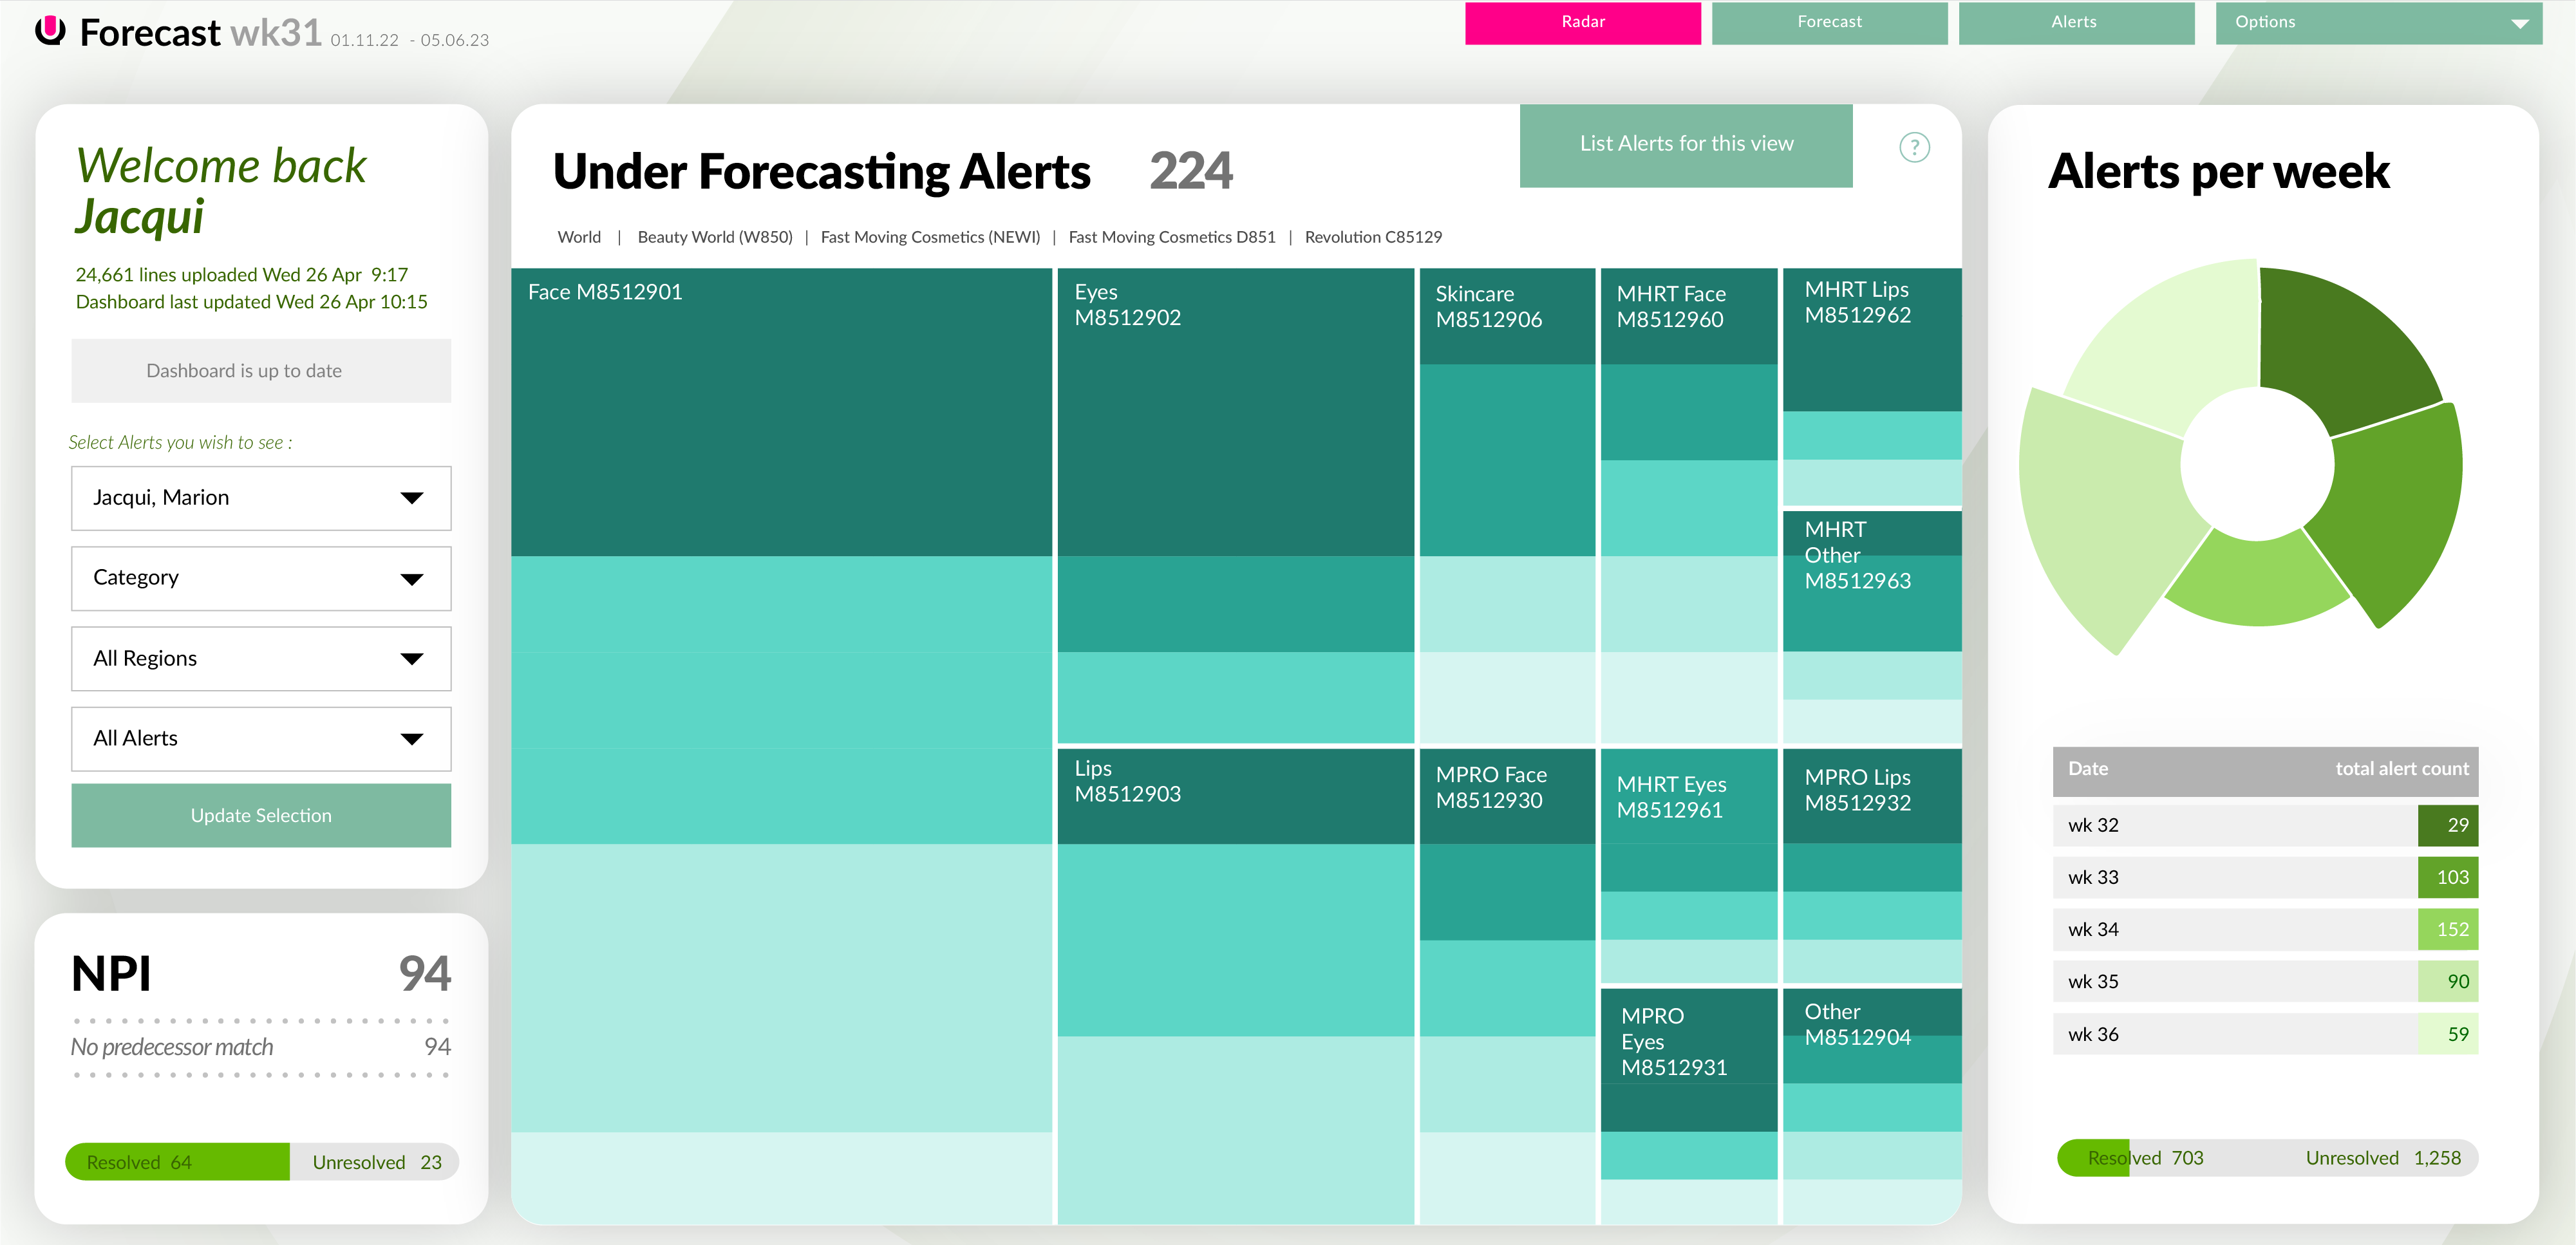
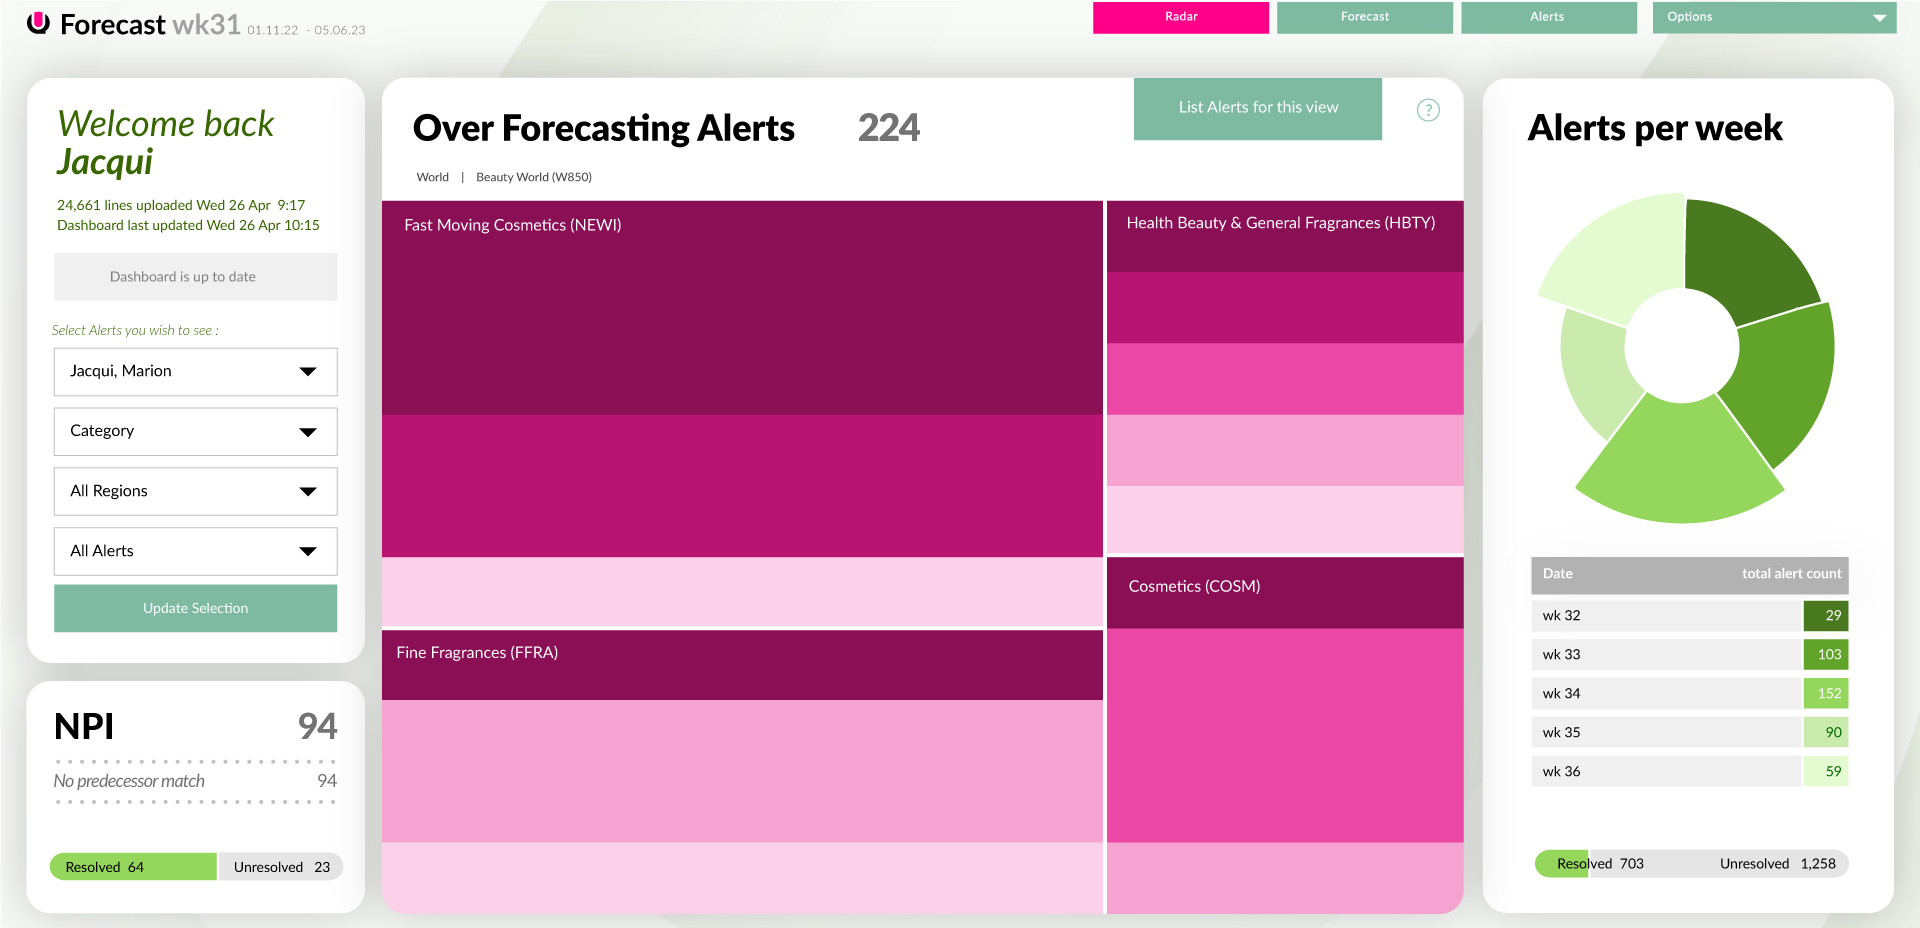
The Dashboard describes problems with stock and forecast in terms of under and over forecast products, by Urgency and by the amount of units effected.
User can drill into the child groups from this tree map and then further into the QU app from there in order to examine the alerts in context.
There are colour options that can be set, this was made easy by using HSLA markup in the CSS which meant only having to change the hue figure.

The data grid can handle thousands of rows and columns very quickly. The table has a targetted set of functionality observed from the workflow of Demand Planners who traditionally use many complex Excel Spreadsheets
The ML/AI disaggregation of changes made to forecasts based on previous sales as well as many unorderred data sets such as brand sentiment means that changes rarely need to be made at the lowest SKU level, saving days of work a week.
The first release of QU was researched, designed and built in just under 6 months. It was a daunting, collosal task which, through the BEST teamwork, we managed to pull off. Most of our user testing had to be internal, although there was limited external testing. I built prototypes in XD, and all wireframes and markups in Illustrator. I battled with React componants and pixel pushed the end product with CSS.